IMPLEMENTATION PROCESS
IDENTIFY MATERIALS/PRODUCTS > DEVELOP CODE SYSTEM > EVALUATE FORECAST PROCESS > UNDERSTAND VARIABLES & CONSTRAINTS > ASSIGN SCHEDULING PARAMETERS > IDENTIFY DYNAMIC DATA SOURCES > INTEGRATE DATA SOURCES TO MODEL > TEST & HONE PARAMETERS

IMPLEMENTATION RESULTS
Uunderstand Supply Chain Capacity
Manufacturing capacity is affected by the slowest rate of any piece of equipment in the manufacturing process. Many times, the same equipment is used for making multiple products. When this is the case, it is called block-operating and a series of products (a campaign) is made before the first product is made again.
All time spent cleaning and retooling the equipment for the next product to be made is called changeover time. The aggregate of all changeover time is lost capacity when no product is made. Therefore, the more products that are made on the same equipment, each additional product erodes the annual capacity of the entire production facility due to the additional changeovers. Different products can have different run rates. The campaign time is the aggregate time of all changeovers plus the time to make every product. The order in which the products are made is called the sequence. Cleanout and setup between individual products can vary in time depending on the nature of the equipment and the products themselves. Therefore, there is usually a preferred sequence to minimize the changeover time.
Some software attempts to explicitly model all above issues. Our software approximates the capacity impact. There is a tradeoff between model maintenance and model granularity. The point is to get to 80% of the solution with 30% of the effort. The approximation can be compensated for by adjusting the network safety stock.
Faster Reaction
A typical schedule process is broken down into gathering the dynamic data; analyzing and generating the schedule; communicating the new schedule to the organization. 90% of the total cycle time is spent on the first step, gathering fresh data. It would not be unusual to spend days generating each new schedule. The integration of the models to the business system plus other data sources highly automate this step. The second step automates generating schedule even more. The result is now 90% of the effort can be focused on generating better schedules and preparing for potential future events. The result is faster reactions and better decisions.
Greater Visibility
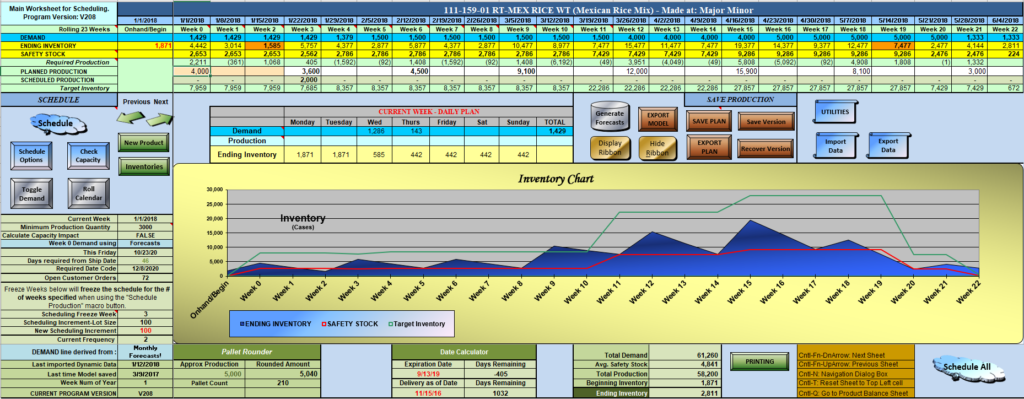
The organization of the model formats the information for maximum visibility of the current situation and over 20 weeks into the future. Everything about the model is arranged to make it easy to change scheduling parameters and try different demand scenarios. Complex or simple situations can be tested, solved, and saved if need be. Calculating potential scenarios into the future gives the planner insights into when they need to start preparing and acting to mitigate potential shortages or other problems. Think of it like a radar being used to track a hurricane coming onshore towards your home.
Inventory Accuracy
There are three parts to every trip: starting point, path/route, and destination. The starting point for a production schedule is the current on-hand inventory. When the starting inventory is inaccurate then all the scheduling based on it is wrong and costly. Typical symptoms are expedited shipping, stock-outs and schedule interruptions. Building a scheduling model forces you to examine the timeliness of the data especially from third party warehouses. Every time you want to update the current inventory, ensure that all transactions have been posted to the systems (internally and externally). Note that current (perpetual) inventory is a calculated number based on all transactions at each location. These are only adjusted when a physical count is made at the respective location. Also note that in-transit inventories are also counted, up to the time ownership transfers.
Clearer Picture
The combination of all the issues: capacity, more frequent scheduling, time-phased scheduling (20+ weeks out), analysis of multiple potential scenarios and greater accuracy provides a much clearer picture of the current situation and what to expect. This is the difference between driving in the fog vs. having much clearer understanding of the road ahead. This automatically gives you more time to plan and react.
Better Decisions
When you have a clearer picture of the supply chain situation plus a radar of the future then you understand what to do and when you must act. Basically, you can monitor a situation developing and if the seriousness of the situation changes then you can act in a more measured way.
The models are run based on quantities of products and materials. However, the software provides the ability to add costs for all activities. Therefore, the schedules can be converted to either costs or profitability impact. Keep in mind that you generate schedules based on inventories quantities and you adjust risk to customer service based on safety stock levels. You can certainly reduce inventory and costs which may benefit the short term. However if you go too far and hurt customer services levels then it may have an impact on future sales.